A Deep Dive into the Unique Power Flow Tracing Feature of COVERE²
Marie-Lou Manca
Sustainability Expert
Published
4 December 2025
One of the main services accessible via the COVERE² platform is the Power Flow Tracing (PFT). This method is able to precisely identify the sources of the energy you consume, e.g., coal, gas, nuclear, solar. By applying relevant emissions data associated with each generation source, we can accurately calculate the carbon footprint of electricity consumed at specific locations. No averages, no assumptions: just your accurate data at an incredibly granular level. Bringing you one step closer to achieving your Net Zero goal.
What is Power Flow Tracing?
Power Flow Tracing (PFT) encompasses a set of methodologies designed to calculate power transfers from individual generation points to specific consumption points or branches. Initially developed to allocate costs associated with transmission losses, PFT has found a highly relevant application in the field of sustainability: the determination of the fuel mix of power consumption at a specific point on the power grid. Knowing the fuel mix of consumed power in turn enables you to determine the specific carbon footprint arising from power consumption at a certain point of the power grid.
Power Flow Tracing is essential to achieve Net-Zero Goals. Europe’s certification frameworks, such as Guarantees of Origin (GO) and Renewable Energy Certificates (REC), provide mechanisms for tracing and certifying electricity and its characteristics. However, these schemes are decoupled from the physical flow of electricity and often lack the temporal and locational granularity needed for precise tracking. Read more about the Energy Attribute Certificates (EACs) and their limitations in our blog article here. Power Flow Tracing fills this gap by offering a more granular and accurate approach. It enables stakeholders to trace the movement of electricity across the grid while incorporating emissions data, making it a critical tool for organizations striving to meet Net-Zero commitments.
Eleks Dakar Technology: Certified Excellence by Fraunhofer FIT
The PFT functionality of Eleks’ power grid simulation tool Dakar features an approach that is deeply rooted in foundational PFT scientific literature. As one of Eleks’ oldest and most sophisticated products, Dakar’s importance has grown significantly due to the combined pressures of geopolitical challenges and the global Net-Zero agenda. The scientific review by Fraunhofer FIT validates its reliability and potential for large-scale implementation.
COVERE²’s Unique Role in Enhancing Energy-Related Emissions Data
As companies face increasing regulatory and consumer pressure to address climate change, PFT offers a transformative solution. By significantly improving the granularity and quality of location-based Scope 2 carbon accounting, PFT aligns with the requirements of the Corporate Sustainability Reporting Directive (CSRD) and anticipates stricter regulations on the horizon.
This innovation enables organizations to:
- Transparently track the carbon intensity of electricity.
- Accurately attribute emissions to specific sources and locations.
- Make data-driven decisions to reduce their carbon footprints.
- Overcoming Data Availability Challenges
While PFT provides a robust theoretical and practical framework, its success depends on the availability of high-quality data. Currently, many electricity grids, particularly at the low-voltage level, lack comprehensive data for holistic and precise carbon accounting. Addressing this gap could lead to the development of more detailed electricity maps that illustrate carbon flows and empower CO2-adaptive decision-making for organizations and individuals alike.
The case of Power Flow Tracing at Juntos Farm (Spain)
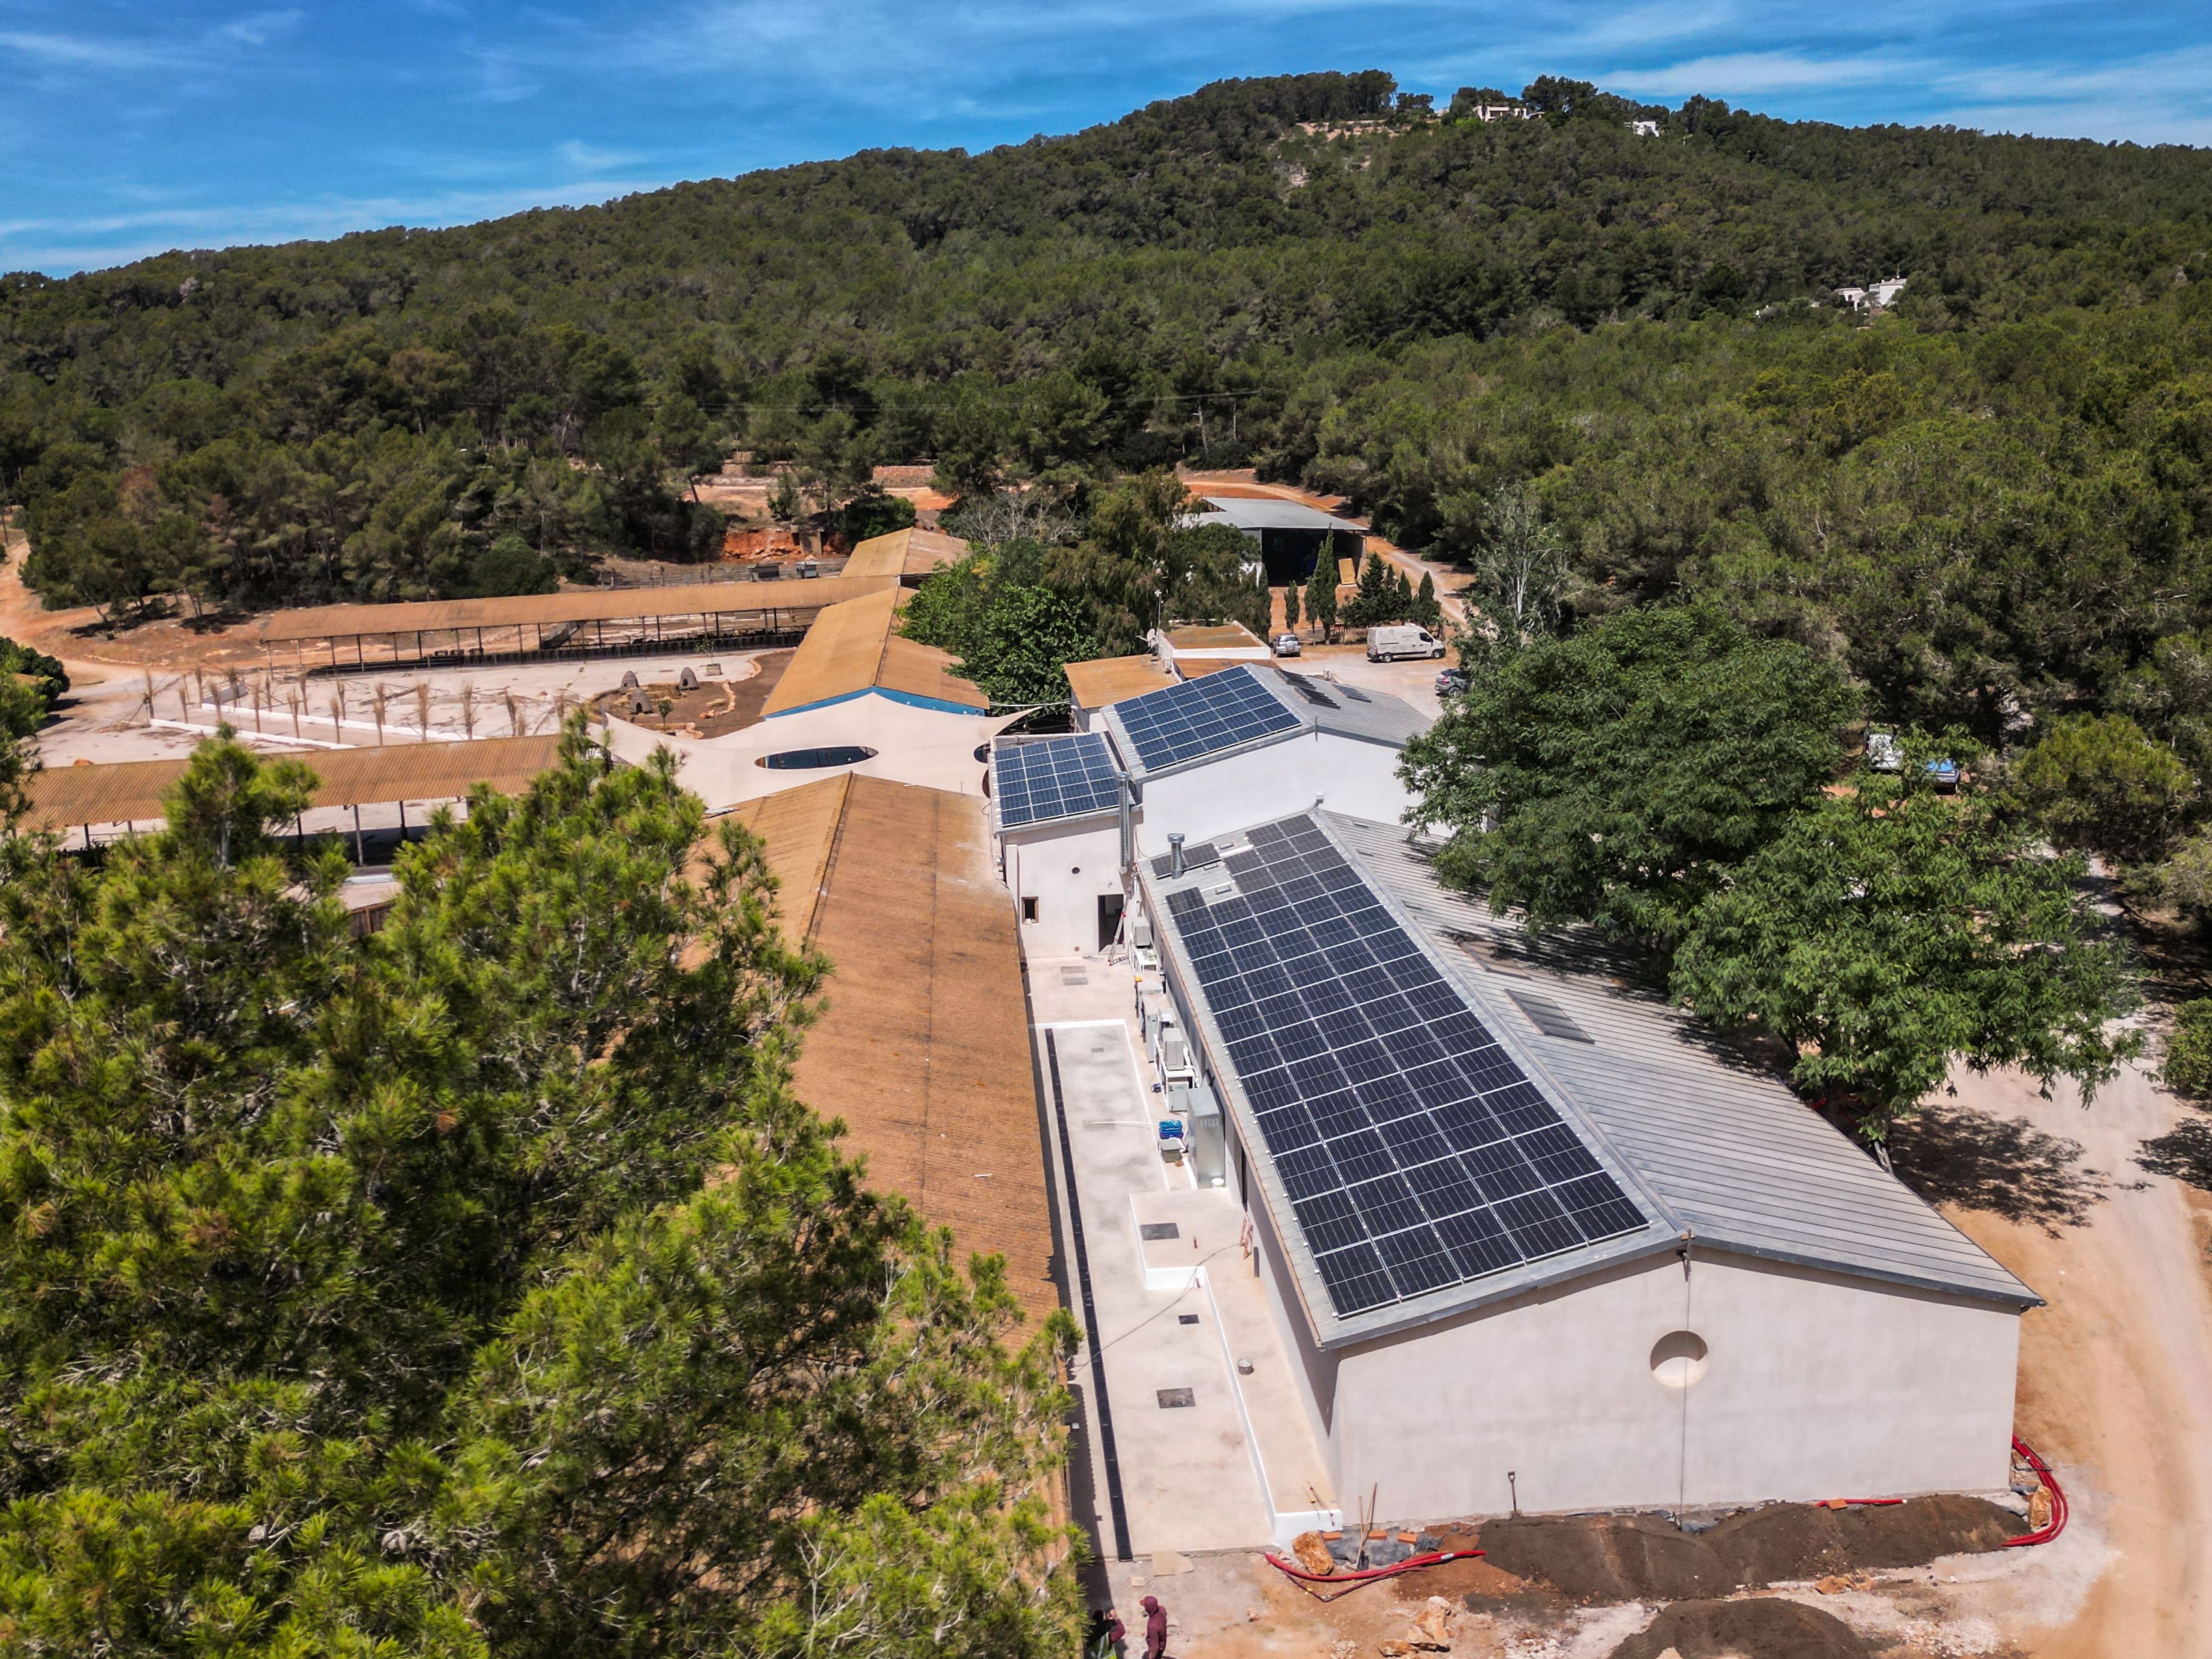
A full PFT assessment was performed at Juntos Farm using the ELEKS DAKAR technology for the month of June 2025. The goal was to measure the carbon intensity of the farm’s electricity, both when connected to the grid and when running on its rooftop solar power plant (67.2 kW capacity). Here’s what we found:
- The carbon intensity of grid-supplied electricity at Juntos Farm was 549.7 g CO₂/kWh, nearly double the national average of 293 g CO₂/kWh.
- This higher value reflects the real-time energy mix specific to the farm’s location, primarily from local gas-fired generation and imported power via Mallorca.
- When the farm operates using its full solar capacity, the carbon intensity drops to just 26 g CO₂/kWh: a 95% reduction in emissions.
- During peak daylight hours, solar output exceeded farm consumption, highlighting potential for energy storage or grid feed-in. Find more about this Business Case in our blog article Setting a New Standard in Energy Transparency: Power Flow Tracing at Juntos Farm.
Looking Ahead
The Fraunhofer Institute’s review of Eleks Dakar underscores the transformative potential of Power Flow Tracing for Carbon Accounting and Energy Transition. Complementarily, it promises to drive the energy sector toward greater transparency and precision, components of a successful shift to Net-Zero. By addressing current limitations in data availability and scaling its implementation, COVERE² and its PFT capabilities are poised to revolutionize how we understand and manage electricity-related emissions.
Additional sources
ELEKS Blog Article - Power Flow Tracing: Scientific Method for Power Footprint Assessment
Get in touch to discuss your goals with our experts
©2026 COVERE², All rights reserved